Power BI Dashboard Development Company in Mumbai

Empower your business decisions with interactive Power BI dashboards and real-time data analytics tailored to your industry.

Get a Free Consultation Learn More
Power BI Data Visualization

Power BI - Data Visualization

In today's data-driven world, making sense of complex information is crucial for growth. Power BI is a powerful business analytics tool by Microsoft that allows you to visualize your data and share insights across your organization. It connects to hundreds of data sources, simplifying data prep and driving ad hoc analysis.

We help you transform raw data from multiple sources-like Excel, SQL databases, or cloud services-into interactive, easy-to-understand dashboards and reports. By translating numbers into compelling visual stories, you can enable smarter, faster, and more accurate business decisions at every level of your company.

Empowering Your Business with Insights

Our Power BI development services provide tailored data visualization solutions to meet your unique business needs. Whether you require real-time analytics, automated reporting, or seamless integration with your existing CRM and ERP systems, our team of experts ensures your data is working efficiently for you.

A well-designed dashboard can completely change how you view your operations. It helps track Key Performance Indicators (KPIs) effortlessly, uncover hidden market trends, and predict future outcomes based on historical data. Give your team the confidence to make data-backed decisions and stay ahead of the competition.

Power BI Dashboards

Power BI Implementation Services in Mumbai

Microsoft Power BI has become the leading business intelligence platform for mid-market organisations globally, and its adoption in Mumbai is accelerating rapidly. The combination of its deep integration with Microsoft 365 (Excel, SharePoint, Teams, Azure), its relatively accessible pricing and its powerful visualisation capabilities make it the natural choice for businesses already in the Microsoft ecosystem.

But Power BI implementations fail more often than they succeed when they are not properly planned. The most common failure mode is building dashboards before the underlying data is clean, consistent and properly structured. SSIS India's Power BI implementations are data-first we spend as much time on data preparation and modelling as on the dashboards themselves, because the most beautiful Power BI report built on poor data is worse than no report at all.

Data Sources We Connect to Power BI

Power BI can connect to hundreds of data sources natively, and we have experience with all the major sources used by Mumbai businesses. For structured databases we connect SQL Server, MySQL, Oracle, PostgreSQL and Azure SQL Database. For business applications we connect SAP, Tally (via our custom SQL connector), Zoho, Salesforce, Dynamics 365 and your custom-built ERP or CRM. For flat files and cloud storage we connect Excel, CSV files, SharePoint lists, Google Sheets and OneDrive. For REST APIs we connect to any web service that exposes JSON or XML data logistics tracking APIs, government data portals, industry data feeds and more.

Where direct connection is not feasible or creates performance issues, we design SQL Server or Azure data warehouse environments that serve as the aggregation layer data flows from all sources into the warehouse, and Power BI connects to the warehouse rather than directly to production systems.

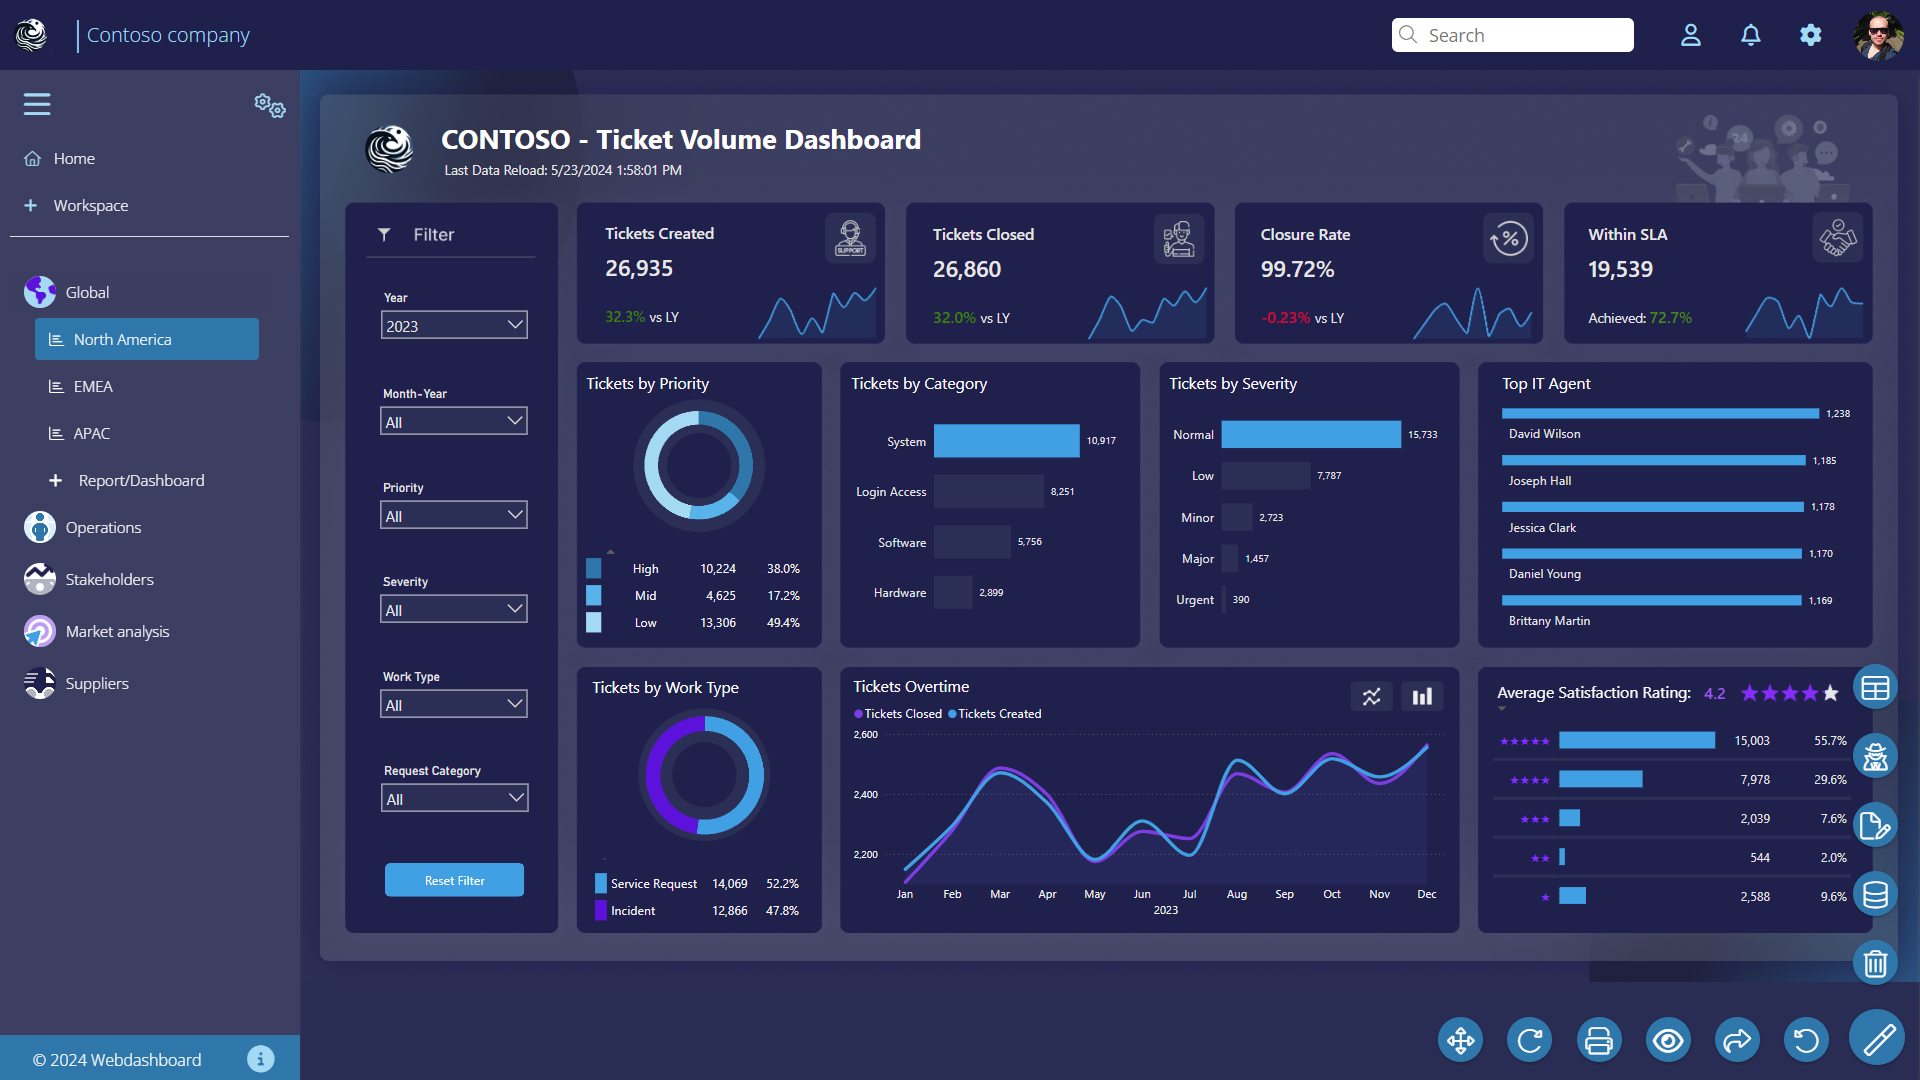
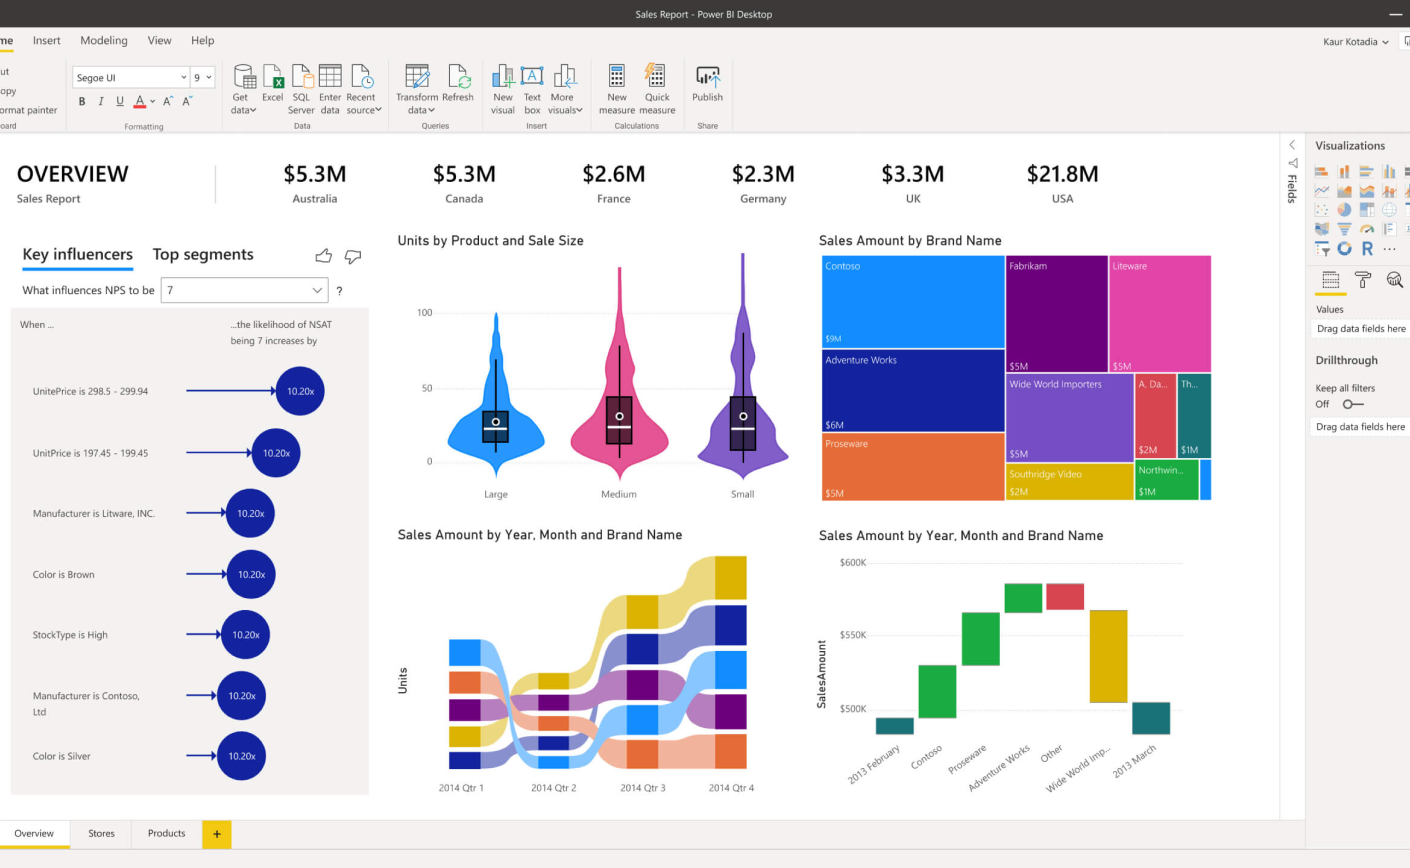
Power BI Dashboard Design Principles

A well-designed Power BI dashboard should answer its primary business question in under 10 seconds for any user. This requires disciplined design choosing the right chart type for each metric, using colour intentionally to direct attention, keeping each report page focused on a single audience or decision, using drill-through and drill-down for detail without cluttering the summary view, and following consistent visual standards across all reports so users can navigate intuitively.

Our dashboards are designed by people who understand both data visualisation theory and the specific business context of each metric. A sales manager and a CFO need different views of the same data we build both, optimised for how each person actually uses information.

Power BI Security and Access Management

Row-Level Security (RLS) in Power BI ensures each user sees only the data they are authorised to see. A regional sales manager should see data for their region only; a plant head should see their plant only; group management sees everything. We implement RLS in the Power BI model and complement it with workspace-level access controls and sensitivity labels for reports containing confidential financial data. For organisations with Active Directory or Azure AD, user permissions are managed centrally and changes propagate automatically to Power BI.

Power BI Training and Adoption

The best-designed Power BI dashboard fails if users do not trust or use it. We provide structured training for three audiences: report consumers (how to navigate, filter, drill down and export), report editors (how to modify existing reports and create new ones in Power BI Desktop), and data stewards (how to manage data refresh, monitor gateway health and manage user access). We also conduct post-deployment review sessions at 30 and 90 days to incorporate feedback, add requested views and ensure adoption is meeting management expectations.

Our Development Process: From Requirement to Delivery

Every project at SSIS India follows a structured process that has been refined over 22 years and 500+ projects. This process is the primary reason our projects consistently deliver on time and within budget while other development companies struggle with scope creep, communication failures and post-delivery defects.

Phase 1 Discovery and Requirements: We begin every project with a structured requirements engineering phase. Our business analysts conduct in-depth interviews with all stakeholders, document current workflows, map out the desired future state and produce a detailed Software Requirements Specification (SRS). This document is the foundation of the project every feature, every workflow, every report is defined and agreed upon before development begins. Changes during development are managed through a formal change request process, so scope creep never surprises either party.

Phase 2 Design and Architecture: Our architects design the system structure, database schema, API interfaces and user interface flows. UI/UX designers produce wireframes and visual designs that go through your approval before development begins. We choose the technology stack that best fits your requirements, infrastructure constraints and team's maintenance capability not the stack that is most convenient for us.

Phase 3 Agile Development: Development happens in two-week sprints. At the end of each sprint you receive a working demo of completed features. You test them, provide feedback and influence priorities for the next sprint. This eliminates the traditional problem of receiving a completed project that does not match expectations you see the product being built incrementally and can guide it in real time.

Phase 4 Testing and QA: Our dedicated QA team runs functional testing, integration testing, performance testing and UAT support on every project. Test cases are mapped to requirements so no agreed functionality is missed. Defects are tracked and resolved before go-live.

Phase 5 Deployment and Go-Live Support: We manage the full deployment server configuration, database migration, user training and go-live support. Our team is available on-site or remotely during the critical first days of live operation to resolve any issues immediately.

Our Annual Maintenance Contracts ensure your system remains reliable, secure and current after go-live, with defined SLAs for response and resolution times. See our case studies to understand the results this process delivers.

SSIS India provides Power BI implementation, training and managed analytics services to businesses across Mumbai and India. Contact us at +91-9923105711 to schedule a free Power BI readiness assessment for your organisation.